The Rudiments of OCDI
A plain-language explanation of the Ownership-Control Divergence Index
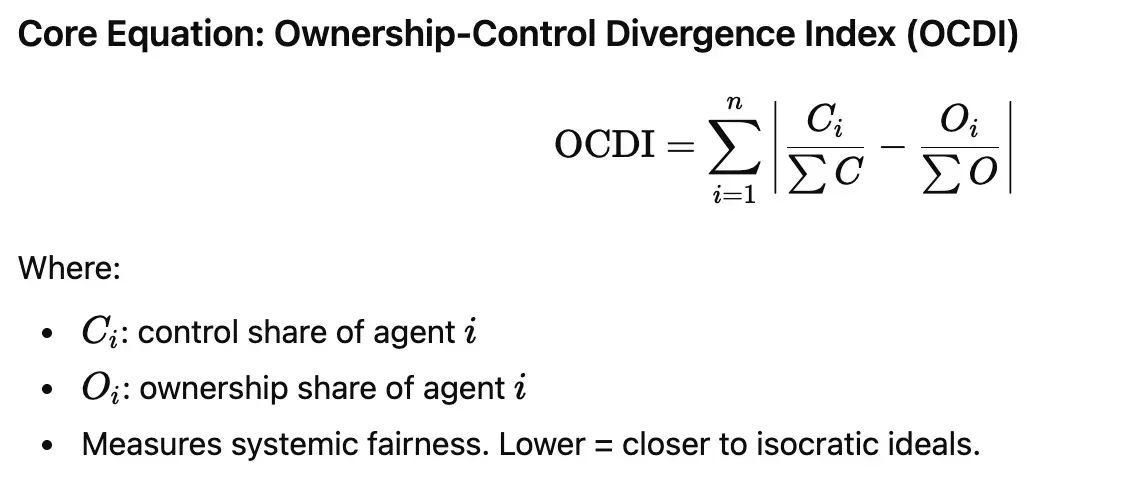
The Ownership-Control Divergence Index measures how far a system is from a fair balance between ownership and control. It compares how much of something each actor owns with how much real decision-making power that actor has.
The Basic Idea
The formula compares two things for each person, group, or institution in a system:
- Ownership means how much of the thing is legally theirs.
- Control means how much power that actor actually has over decisions.
The central question is simple: does each actor's real power match that actor's share of ownership? If yes, the system is more balanced. If no, the system is more distorted.
What the Symbols Mean
| Symbol | Meaning |
|---|---|
| i | One specific actor in the system — a person, company, board, government office, or group of citizens. |
| n | The total number of actors being measured. |
| Cᵢ | The control share of actor i — how much decision-making power that actor has. |
| Oᵢ | The ownership share of actor i — how much of the asset, resource, or institution that actor owns. |
| ΣC | Total control in the whole system. |
| ΣO | Total ownership in the whole system. |
| | · | | Absolute value — ignores whether the mismatch is positive or negative, and just measures the size of the gap. |
What the Formula Does — Step by Step
- Find each actor's share of total control.
- Find each actor's share of total ownership.
- Subtract one from the other to show the mismatch.
- Take the absolute value so every mismatch becomes a positive amount.
- Add all those mismatches together to get one overall score for the whole system.
What the Final Number Means
- A low OCDI means ownership and control are closely matched — a more balanced structure.
- An OCDI of 0 would mean perfect alignment: each actor's share of control exactly matches each actor's share of ownership.
- A high OCDI means ownership and control are far apart — a more distorted system, where some actors may control much more than they own, or own much more than they can influence.
Example 1: A Strongly Unbalanced System
On paper, ownership looks equal. In practice, power is not equal.
Example 2: A Perfectly Aligned System
between ownership and control.
What the Formula Can Indicate
- It can reveal hidden unfairness — a system may look fair because ownership is spread out, but real decision-making power may still be concentrated.
- It can show oligarchy or elite capture, where a small group controls much more than its actual stake would suggest.
- It can show disenfranchisement, where actors own a lot but have little real voice.
- It can help judge institutional health — a lower OCDI may suggest more accountability; a higher OCDI may suggest corruption risk, legitimacy problems, or future instability.
Why the Formula Matters Philosophically
- This formula is not only mathematical. It expresses a moral and political question: who should have power?
- In some systems, more ownership is treated as a reason for more control. In democratic systems, political control should not depend on wealth. In isocratic systems, concentrated control is treated as a danger that must be limited.
The formula therefore helps turn a vague concern such as "this system feels unfair" into something that can be measured and discussed more clearly.
Why a Lower OCDI Is Closer to Isocratic Ideals
In an isocratic framework, a lower OCDI means fewer mismatches between who is affected and who rules.
- Less concentration of decision-making power
- More accountability
- A closer fit between stake, responsibility, and influence
This does not necessarily mean that every person owns equal amounts of everything. It means that control is not allowed to drift too far away from legitimate stake, participation, or public accountability.
One Important Limitation
The formula does not answer every moral or political question by itself. It does not decide whether ownership should be equal or unequal, whether expert control is justified, or whether public goods should be privately owned. It only measures how much mismatch exists between ownership and control.
A Simple Way to Remember It
Imagine a group project in school:
- If one student does a quarter of the work and gets a quarter of the say — that is aligned.
- If one student does very little but makes almost all the decisions — that is a mismatch.
- If another student does a great deal but has almost no voice — that is also a mismatch.
OCDI measures the total amount of that mismatch across the whole system.
Final Interpretation
- OCDI is a way to measure power imbalance.
- It indicates whether a system is balanced or distorted.
- Whether ownership and control fit together or come apart.
- Whether some actors dominate beyond their stake.
- Whether others are excluded despite having a stake.
How OCDI Is Estimated in This Atlas
The formula above is exact, but it needs ownership and control figures for every actor. For most entities on the live map these are not yet audited, so the Atlas assigns OCDI by transparent approximation and labels how certain each value is:
- Structural heuristic. Each company, government, or organisation is placed in an ownership/control class from public governance facts — state-controlled, founder or dual-class control, family-controlled, widely-held institutional — and the class maps to an OCDI proxy. Concentrated and state control diverge most; widely-held ownership diverges least.
- Private/oligarch entities use the wedge directly: the absolute gap between an individual's estimated economic ownership and their voting/effective control of their holdings.
- Governments use a governance class (consolidated-democracy through authoritarian) to express divergence between nominal public ownership and concentrated control.
Each point's marker encodes how trustworthy its score is — audited data renders solid; heuristic and estimated data render fainter and dashed; unspecified data renders dotted. The detail popup names the source, the provenance tier (live feed, one-time snapshot, or curated CSV), and the confidence level. These heuristic scores are a starting layer, to be replaced by audited ownership/control data as it is sourced. See the methodology page for the full scheme.